







Madhouse Bakehouse
All-Australian wholesale bakery.
View case study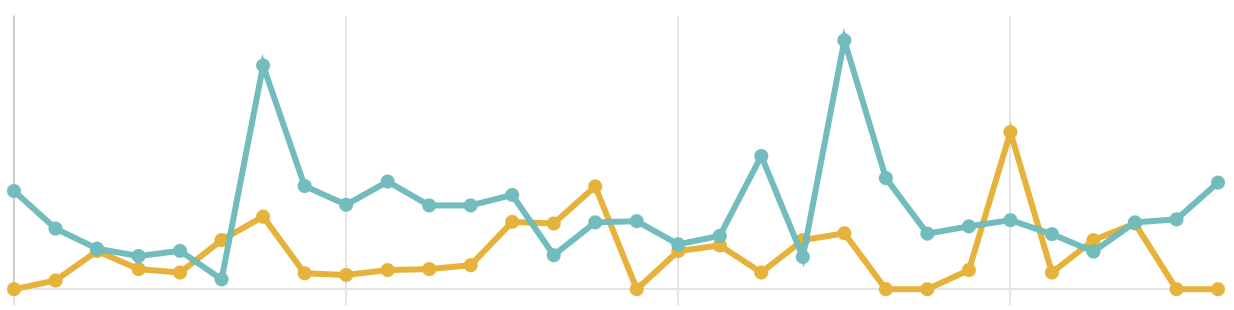
Bring sales, purchasing, inventory, production, waste, customers and locations together without rebuilding reports from separate systems. Because Supply’d records the work as it happens, reporting remains connected with the underlying products, orders, batches and transactions behind each result.
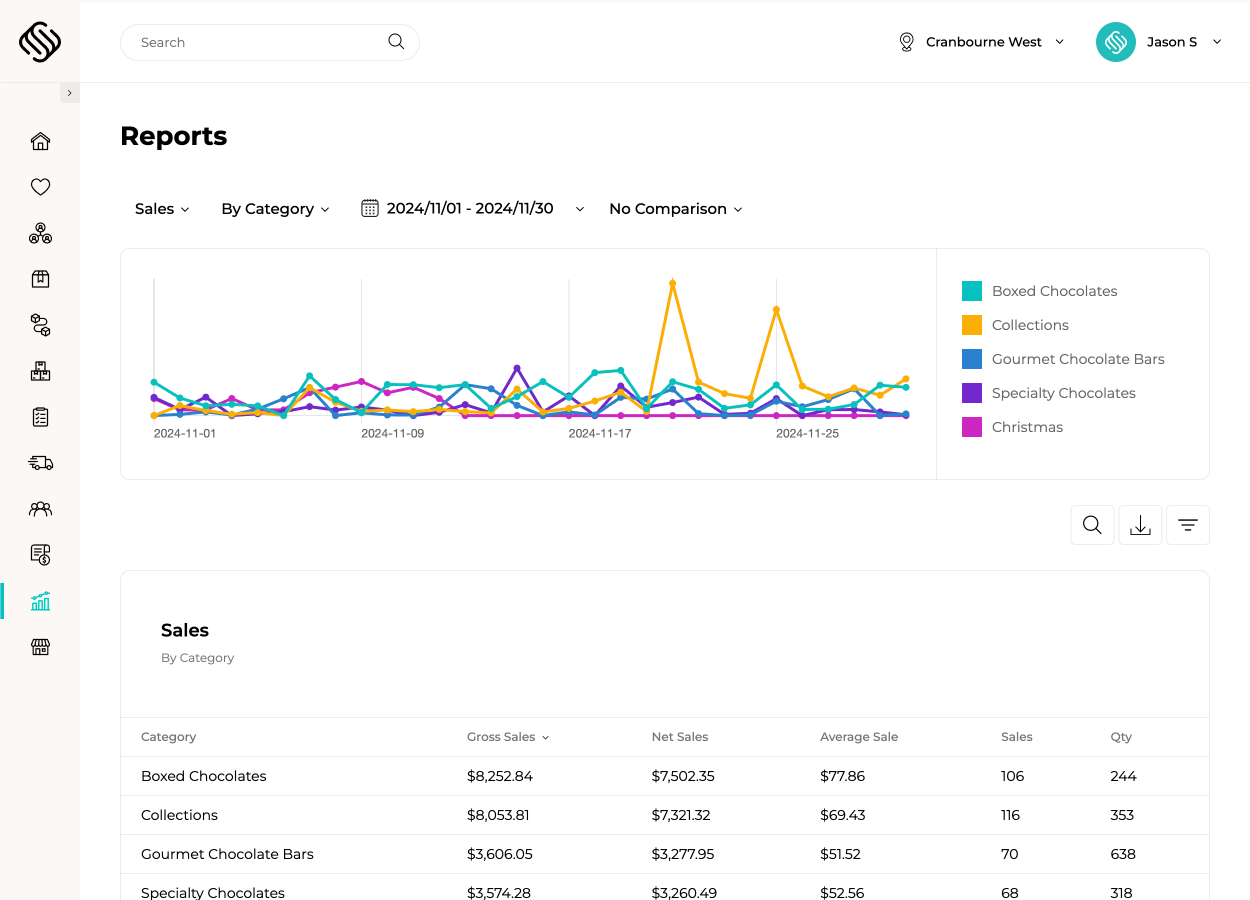
Track gross sales, net sales, cost and margin using live data from across the business. Review performance by product, customer, location, salesperson or sales channel, then drill into the transactions behind the result instead of waiting for static month-end spreadsheets.
Compare any selected date range across up to 24 previous periods to understand how performance is changing. Review sales, quantities, margin and other measures by day, week, month, quarter or year to identify growth, seasonality and unusual movements.
Filter and group reporting by product, category, customer, customer group, location, salesperson, order source or sales channel. Compare wholesale, retail, ecommerce, stores, warehouses and production sites while retaining the ability to investigate the transactions behind each result.
Save reports with their selected measures, filters, groupings and comparisons, then schedule them to be emailed automatically at the required interval. Managers, team members and stakeholders receive consistent reporting without someone rebuilding and distributing the same report each time.
 Powered by Supply'd Intelligence
Understand how many days, weeks or months of stock you have on hand using expected future demand rather than relying only on historical rate of sale. Choose trend-based forecasting using moving averages or use Supply’d Intelligence to account for factors such as weather, seasonality, public holidays and school holidays. These forecasts help identify products at risk of running out or carrying excessive stock across future periods.
Compare expected recipe costs and production yield with the actual ingredients, labour and finished quantities recorded during production. Supply’d helps identify ingredient overuse, poor yield, unexpected waste and cost movements while keeping the result connected with the relevant production run and batch.

Explore how food manufacturers, bakeries, wholesalers and retailers use Supply’d ERP to run their operations.
Book a demoSupply’d ERP is built around the workflows food manufacturers, distributors and retailers rely on every day.
Supply’d is built around the way food and retail businesses actually operate. We combine deep industry understanding with connected technology to deliver reporting software that improves control, reduces manual work and connects teams across the operation.
Business intelligence software helps businesses analyse operational and financial information to understand performance, identify trends and make better decisions. Supply'd connects reporting directly with sales, purchasing, inventory, production, customers and locations.
Yes. Supply'd is designed for food manufacturers, wholesalers, distributors, bakeries, butchers, retailers, central kitchens and other food businesses managing sales, stock, expiry dates, production and operational performance.
Yes. Reports use connected information recorded throughout Supply'd, allowing teams to review current sales, inventory, production and other operational results without rebuilding data across separate systems.
Yes. Supply'd can report on gross sales, net sales, quantities, cost and margin across products, customers, locations, salespeople, sales channels and selected periods.
Yes. Sales and cost information can be used to calculate gross margin across products, orders, customers, categories, locations and other reporting groups.
Yes. Product sales, costs and margins can be reviewed individually or grouped by category, location, customer or channel.
Yes. Reports can show sales, quantities, margin and other measures by customer or customer group.
Yes. Sales can be filtered or grouped by salesperson to help managers compare revenue, margin, customers and product performance.
Yes. Reporting can be filtered by sales channel or order source so wholesale, retail, ecommerce and other parts of the business can be compared using consistent data.
Yes. Orders can be analysed by their source, including supported ecommerce, point-of-sale, B2B, marketplace and internal sales workflows.
Yes. Sales, margin and other measures can be filtered and grouped by store, warehouse, production site or operating location.
Yes. Products can be grouped by category or other maintained product attributes to compare performance across ranges and departments.
Yes. Reporting remains connected with the underlying products, orders and transactions so authorised users can investigate the detail behind a result.
Yes. Users can compare a selected reporting period with previous periods to understand growth, decline, seasonality and unusual movements.
Supply'd can compare a selected date range across up to 24 previous periods, depending on the report and comparison settings used.
Yes. Reports can be reviewed across daily, weekly, monthly, quarterly, annual or other selected date ranges.
Yes. Year-on-year comparisons can be created using the selected reporting period and comparison settings.
Yes. Reports can be filtered by relevant dimensions such as product, category, customer, customer group, location, salesperson, sales channel and order source.
Yes. Multiple filters can be combined to narrow the report to the products, customers, locations or transactions being investigated.
Yes. Results can be grouped using the dimensions supported by the report, allowing users to compare performance across categories such as products, customers, locations or channels.
Yes. Inventory reports can show stock on hand across products, batches, warehouses, stores and other stock locations.
Yes. Inventory value can be reviewed across products and locations using the stock and costing information maintained in Supply'd.
Yes. Stock movement reporting can help users understand receipts, transfers, production usage, sales, write-offs and other inventory changes.
Yes. Rate-of-sale information can be reviewed alongside current inventory to help teams understand how quickly products are moving.
Yes. Stock coverage reports can estimate how many days, weeks or months current inventory may last based on the selected usage or forecasting method.
Yes. Inventory and rate-of-sale information can help identify products that are moving slowly or holding more stock than expected demand requires.
Yes. Reports can highlight products with strong sales or usage that may require closer purchasing, transfer or production attention.
Yes. Batch and expiry reporting can identify stock approaching its expiry or best-before date across products and locations.
Yes. Inventory reports can identify batches that have passed their maintained expiry or best-before date.
Yes. Where batch tracking is used, short-dated and expired inventory can be reviewed against the specific batch and expiry date.
Yes. Short-dated and expired inventory can be reviewed across warehouses, stores and other stock locations.
Inventory, expiry and rate-of-sale reporting can help teams identify where stock may be better used at another location, with transfers then managed through the relevant inventory workflow.
Yes. Write-off reporting can show quantities, values, reasons, products, batches and locations associated with damaged, expired or otherwise unusable stock.
Yes. Waste information recorded through inventory and production workflows can be analysed by product, reason, batch, location or selected period.
Yes. Production reports can include expected and actual material, labour and other configured production costs.
Yes. Expected recipe costs can be compared with the actual ingredients, substitutions, labour and outputs recorded during the production run.
Yes. Production reporting can show expected and actual finished quantities and yield for each production run or batch.
Yes. Teams can compare the expected output from a recipe or plan with the actual quantity produced.
Yes. Reports can help identify differences in ingredient usage, labour, output, yield, waste and cost across production runs.
Yes. Production results remain connected with the relevant production run and finished batch.
Yes. Supply'd can forecast future sales or usage using trend-based or AI-powered forecasting methods.
Trend-based forecasting uses historical sales or usage patterns, such as moving averages, to estimate expected future demand.
AI-powered forecasting uses historical information alongside relevant external and seasonal factors to estimate future demand more dynamically.
Yes. AI forecasting can use weather information where relevant to help account for demand changes associated with expected conditions.
Yes. Forecasting can account for recurring seasonal patterns found within historical sales and usage information.
Yes. AI forecasting can consider public holidays where they are relevant to expected demand.
Yes. School holiday periods can be considered by the AI forecasting model where they are relevant to the business and location.
Yes. Users can select the forecasting method appropriate to the product, report or operational decision being made.
Expected future demand can be compared with current stock to estimate how many days, weeks or months of inventory are available.
Yes. Forecast usage and current stock coverage can help identify products that may run short across the selected future period.
Yes. Forecast stock coverage can help identify products carrying more inventory than expected demand requires.
Yes. Report configurations can be saved so users can return to the same measures, filters, groupings, date ranges and comparisons without rebuilding them.
Saved reports can retain the selected report configuration, including relevant measures, filters, groupings, date ranges and comparison settings.
Yes. Saved reports can be scheduled to run automatically at the required interval.
Yes. Scheduled reports can be emailed automatically to selected recipients.
Yes. Reports can be scheduled for daily delivery where that interval is required.
Yes. Saved reports can be scheduled for weekly, monthly or other supported reporting intervals.
Yes. Reports can be distributed to selected internal or external recipients according to the reporting workflow and permissions configured.
Yes. Saved and scheduled reports reduce the need for users to repeatedly rebuild the same report and manually distribute it each reporting period.
Yes. Supported reports can be exported to CSV for further analysis, stakeholder reporting or use in external tools.
Yes. The export reflects the report configuration and selected filters used when the report was generated.
Yes. CSV exports can be opened in supported spreadsheet and analysis tools for further modelling or presentation.
Yes. Authorised users can review consolidated information across multiple locations or filter reporting to an individual site.
Yes. Saved, scheduled and exported reports can support recurring management, stakeholder and board reporting using connected operational data.
Yes. Supply'd can consolidate reporting across supported wholesale, retail, ecommerce and internal sales channels while allowing each channel to be analysed separately.
Yes. Supply'd can report across products, batches, expiry dates, locations, stock movements, rate of sale, write-offs, waste and forecast stock coverage.
Yes. Food manufacturers can analyse sales, inventory, ingredient usage, production costs, labour, yield, waste, batches and forecast demand from one connected system.
Yes. Supply'd can provide consolidated reporting across stores, warehouses, production sites and other locations while retaining the ability to investigate individual sites.